A beautiful plot
The aesthetics of scientific plots is one of those things. You don’t have to know what makes something beautiful to recognize that it is beautiful. I’m not sure what provides a plot with that oomph, or je ne sais quoi. Is it just a great Signal-to-Noise Ratio (SNR) that makes the eye sense that something real is being presented? It’s probably more than that! A straight-line plot with great SNR is not usually particularly beautiful. I’d suggest that some complexity has to pop up too, to make the viewer feel there’s interest here beyond the trivial. I’m sure you could train a neural network to sort pretty plots out from non-pretty ones but… whatever… This plot below, as I’m sure you’d agree is very pretty indeed. Tragically, due to very silly psychology reasons (and also maybe the follies of the Scientific Method), it has never seen the light of day until now.
Done is better than perfect
So why wasn’t this plot ever released? An unhealthy mix of perfectionism and procrastination, both arising from that most potent and primordial emotion that is Anxiety. It is triggered by so many different things, and once that dopamine-fueled, lizard-brain targeting snowball gets rolling it’s hard to stop it. In addition, which is a point I mostly see now in retrospect, I was just overwhelmed.
I was afraid I don’t really understand everything about the plot (which I don’t). I was worried that checking any more deeply is going to expose that it’s all a lie and the plot will have to be thrown away (which it might). It’s the fear of the experience of a child that presents a kindergarten painting to a parent only to see it promptly filed in the recycling bin rather than getting a prominent presentation on the in-house Louvre gallery that is the kitchen fridge.
Moreover, I was having a hard time making a game plan for my next steps. There were more ambitious and lofty goals in store, and I felt committed to those as part of my PhD experimental plan. That was a plan that was presented to, and approved by, an external committee. This made it hard to make concrete decisions when looking ahead: should I meticulously write up this part of the experiment, adding supporting evidence and measurement as I go along, or should I just plow on forward? Who knows what should happen if I put too much time and effort into this side-quest? Will I ever reach my end goal? If not, then what’s the point?
Irrespective of my confusion and short-comings, this is also a failure of modern academia and its peer publishing process. It takes a hell of a lot of effort to publish and that puts a fairly high barrier when it’s time to do so. It’s very likely many small side-projects never become known by others simply because of how hard it would be to fully write up something in a what is deemed “sufficient” quality. Would it not be better to just release more raw output in the hope it helps someone, somewhere?
Regardless, this all amounted to a situation where things didn’t seem like they can become perfect and as a result were never fully done.
Rydberg spectroscopy for busy professionals
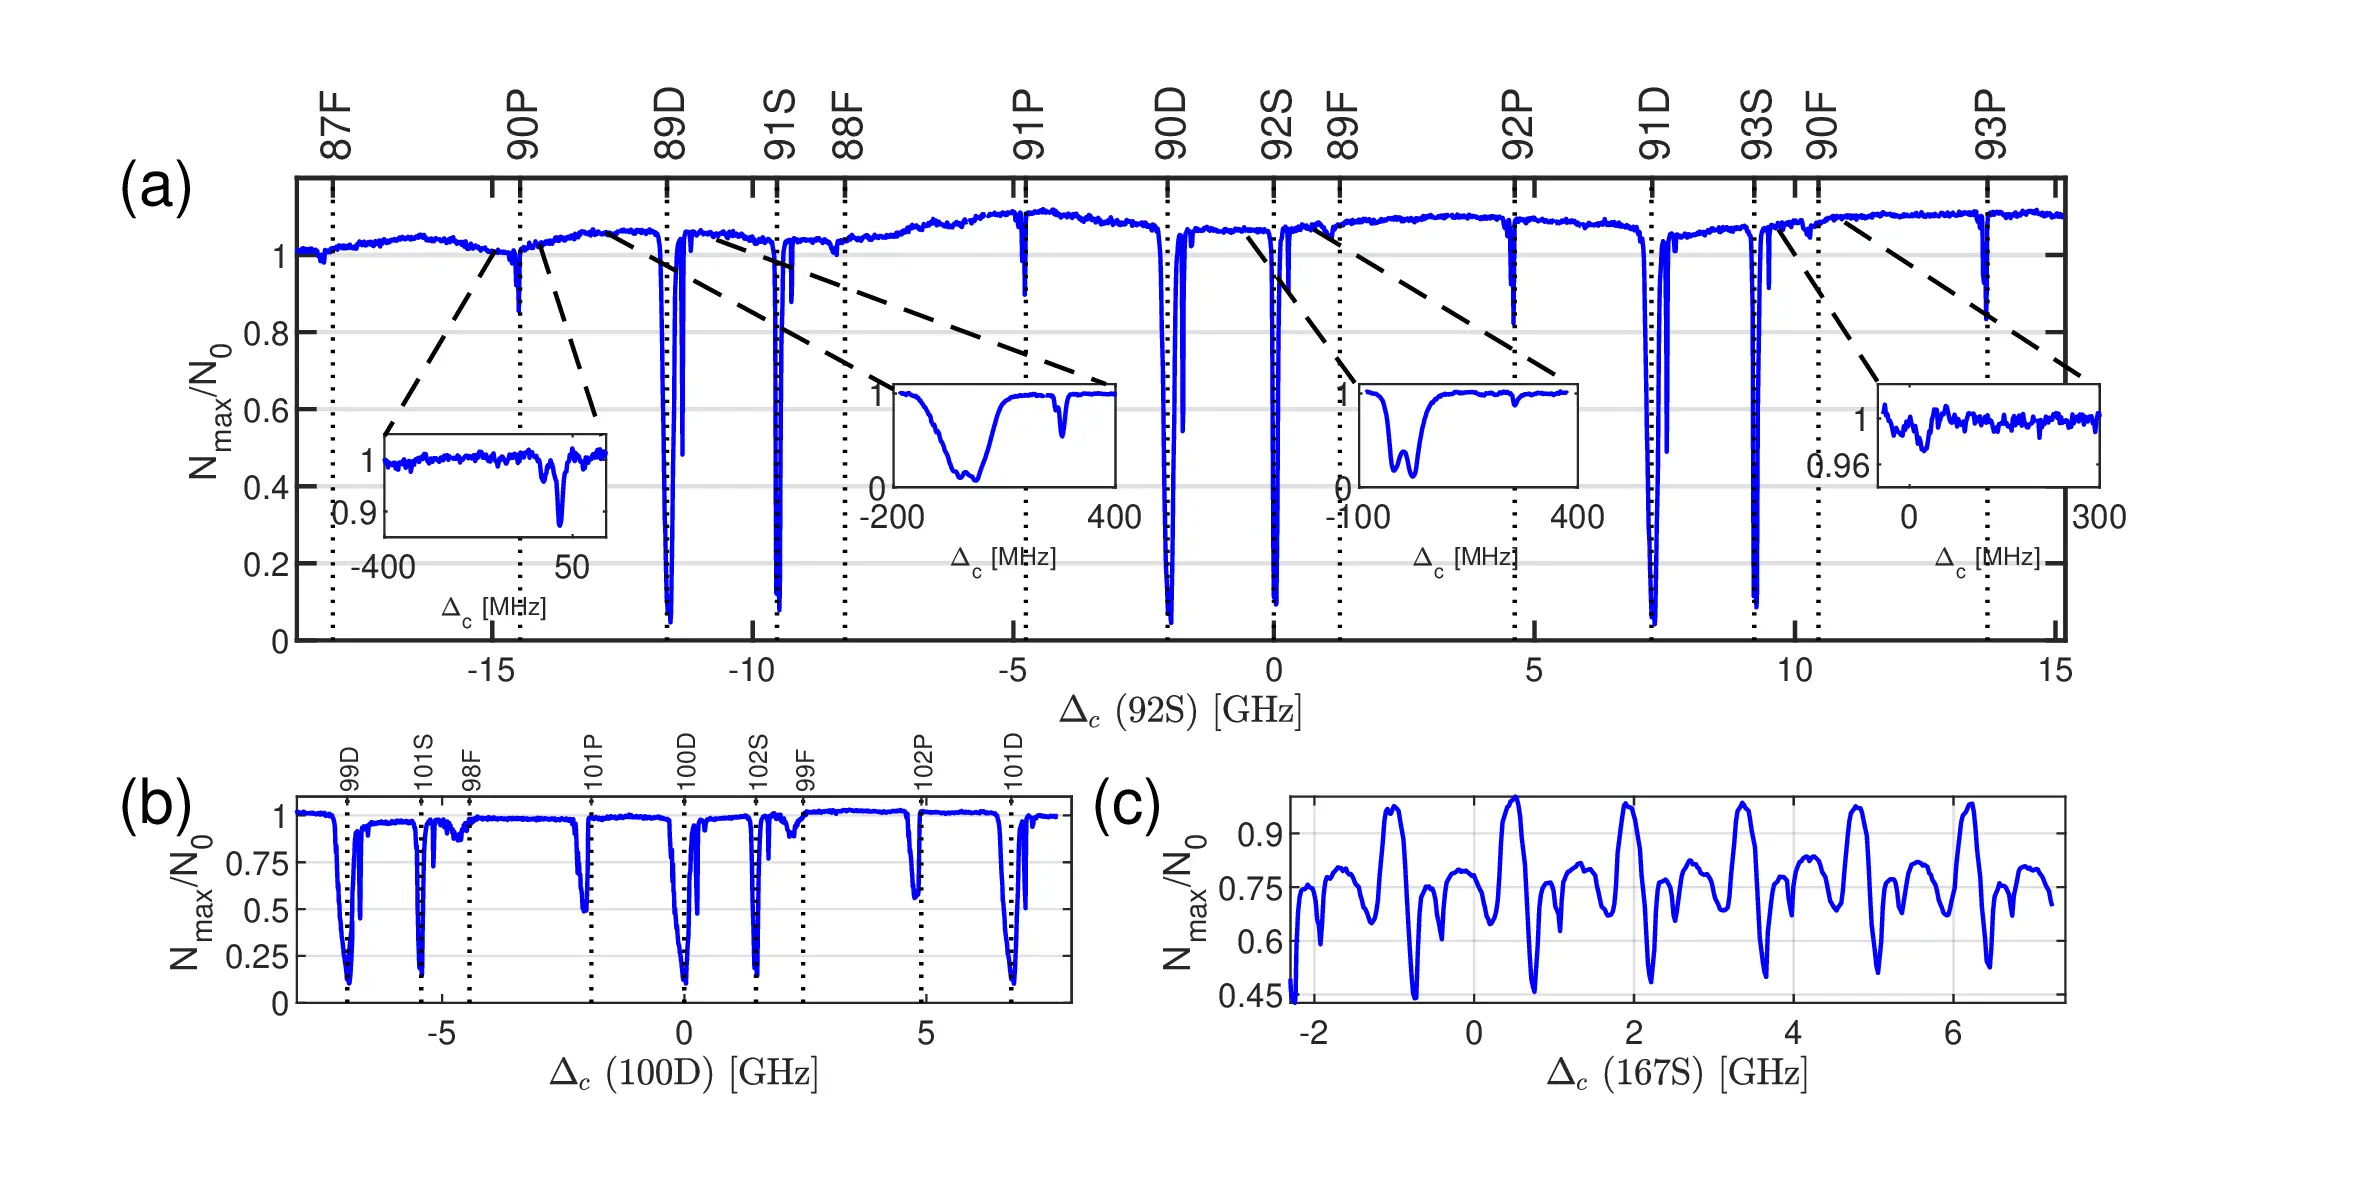
So what’s this plot all about? It’s a measured absorption spectrum of a gas of cold Rubidium atoms, but one done in a cute (and maybe unreported) way.
In spectroscopy we measure how strongly a sample absorbs light as a function of the light’s color.
The absorption spectrum is a nice thing to know as it tells us about internal structure: how a sample (maybe a certain kind of atom) looks like on the inside. This is due that very fundamental and important principle: conservation of energy. Energy can’t just disappear, so if it is lost from a beam of light going into a sample, it must have gone somewhere. Most often: it changed how an electron orbits a nucleus or how a molecule vibrates.
In 2015-2020 I was doing my PhD in Prof. Ofer Firstenberg’s lab in the Weizmann Institute. I was working with a bunch of awesome people such as my great friend Dr. Lee Drori who took the data for this plot with me (and many others) and is also the inventor of the method itself. In this experiment we were interested in Rydberg atoms. Maybe I’ll get into why that was the case in some other post but for now that’s not so important.
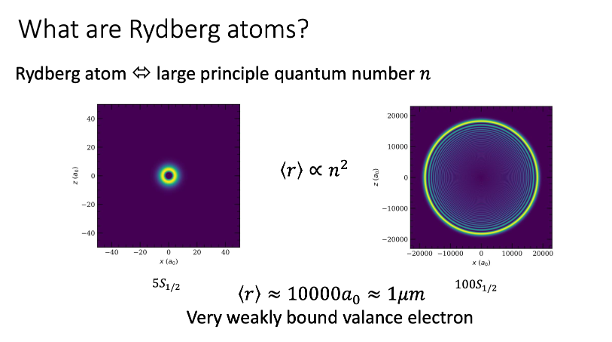
The point with Rydberg atoms is that they have electrons comparatively very far from their nucleus to what one might consider normal. The electrons are thousands of time further away than what would be found in a “mildly” excited atom. The image below, which I took from one of the slides on my PhD defense, shows a Rubidium atom in two different states. The image on the left shows a nice and relaxed atom that hasn’t been bothered by anyone. It’s in the ground state which is indicated by a cryptic label \(5S_{1/2}\) which we shouldn’t worry too much about for now. The bright yellow in the plot is where you are more likely to find an electron in this state and the blue bits are where you’re not so likely to find it. In the image to the right, there’s a Rydberg state. It’s not so precisely defined what counts as a Rydberg state, but this one sure does. This time, it’s not a \(5S_{1/2}\) but \(100S_{1/2}\), the \(100\) being the key number that makes this thing “big”. It may seem at first glance that this is only marginally larger than the other, but if you look closely at the axes’ scale you see we’re dealing with an atom that’s about 10,000 times the size of the ground state version of itself. It’s almost a micron in diameter, which is almost macroscopic!
Sense and sensitivity
These large atoms are useful because the electrons can hardly feel the attraction of the nucleus at all. The electrical forces binding them together barely suffice to keep this system from an inevitable divorce. This weak attraction is actually useful in certain situations because it allows these atoms to be used as sensors. If every little thing is going to push you over the edge, you’re a great litmus test for, well, weak things.
Rydberg atoms can be used to sense very weak electrical fields and in our case we used them to create and observe quantum-mechanical phenomena. But as I said, that’s a story for another day.
So in this plot (if fact: plots), what you see is how much of the light is falling on a photo-diode when a laser frequency (read: color) is changed. Every single point on the blue line is a single reading where the frequency was changed and the amount of light falling on that diode was measured. Note, I didn’t yet say what light is on the photo diode, and it’s probably not what you might expect, and here lies the neat trick that is hidden here.
Each dip represents a way in which the Rydberg atom can absorb light. So each one of those dips represent some energy difference for which the electron in the atom can take the light coming in and move around the atomic nucleus at some other way. It can rotate one way or another, move to some new average distance, be aligned in different ways with respect to the nucleus and so on. There’s A LOT that a trained eye can see by looking a this plot.
The different ways an electron can revolve around the nucleus are the electronic orbitals and the labels specify all the information one may want to know about them. It’s their unique ID. You can see these IDs for each dip on top of the main plots (a),(b) and (c). This makes these plots kind of a map, or a finger print of the Rubidium atom when it is excited (by the laser) into Rydberg states. And as it turns out, this isn’t always something you can just find in a book, and even if you could, the details of your experimental system may shift things around a little.
The great sensitivity of Rydbergs means that even if the light shining on them is too strong, it’s possible to destroy them by kicking out the electron (ionization). So measuring the Rydberg spectrum with a laser by simply looking at how much of a (very weak) laser goes through a cloud of them is not easy. It certainly wouldn’t produced a plot like the one above with nice deep dips and very low noise. So how did we do it?
The blue killer
The trick Lee came up with was cunning. To make cold atoms you need to build a trap for them. This, Magneto Optical Trap (MOT) uses a special arrangement of electro-magnets and lasers to push atoms into one tight place in space. When it works, a ball of a few million atoms clumps up in this well defined place. What’s amazing about it (there’s many amazing things about it) is that because the laser light used is scattered by the atoms (that’s actually how you get to exert a force on an atom, but scattering light off it) you can see this blob of atoms with the naked eye. So there’s quite a bit of light there, relatively speaking to the power of light that brings atoms up to the Rydberg state.
There’s a few ways by which an atom can get to the Rydberg states, but one way is to have two lasers working together. Because there’s a lot of energy needed to bring the electron out so far, instead of making one energy that’s very high up in the electromagnetic spectrum (an ultraviolet laser, which would be inconvenient for many practical reasons) we can use two lasers that have more reasonable colors. One common combination people use is a red laser in conjunction with a blue one. This “ladder” configuration is shown in the image below where we get to the Rydberg state with two steps (that actually happen together).

So here’s the trick: if we use the red light from the MOT with a second laser that is blue, and if the combination of energies of these two laser energies is exactly the amount of energy needed to bring the atom from the ground state to the Rydberg state, then and only then, do we excite the atom to a Rydberg state. But then something great happens - the whole atomic cloud in the trap disappears! The MOT is killed almost immediately. This happens because, unlike the ground state atom, for technical reasons we won’t get into, the Rydberg atom is not trapped. That’s the “Blue Killer” effect and it is great because it give a huge, clean and easy to spot effect.
Summary
So that was that. A nice effect, with a lot more intricate tidbits to speak about if you really look in deep. We could say things about what happens to this effect as we go to really high Rydberg numbers, what electrical fields the atom may be experiencing and how they affect the positions of the dips (as I said, these are sensitive probes), and maybe even more interesting things. But, it just didn’t coagulate into a thing that was ever submitted to a peer reviewed journal.
I took a few lessons from this unfinished paper. But I can’t say I don’t fall into many of the same pitfalls today: not sharing my work because I fear it’s just not good enough. But really, I know that this is a shame. It’s best to share, either you find out it’s much better than you thought or you find the error which is almost always much smaller than you feared.